Data mining is starting to get more and more interest in the big data community of data analysts, ecommerce owners and everyone who’s already discovered data is the new oil. So today we elucidate data mining techniques, what is data mining and how does it work. Let’s dig in! (pun intended) What is data mining? Before […]

Nowadays data analytics is no longer a luxury only large enterprises can afford, but a necessary ingredient in inefficient work of very business. Data analytics tools facilitate data-driven decision making (find out how to become data-driven here) which allows companies all over the world to not only stay in the game but advance ahead of […]

Artificial Intelligence is fascinating, mysterious and undeniably head-turning. It is easily the most discussed topic of the last decade which each and everyone regardless of their age, nationality and gender wants to get their hands on. And small wonder – among the previous technological advancements of a lightbulb, a steam engine, and an online database […]

Google Data Studio is an outstanding data visualization tool – its dashboards are easy to share, its intuitive design makes it simple to use, and the best news of all – its completely free to use! By setting up Google Data Studio integrations with native Google applications like Google Sheets, Google Ads, BigQuery, Google Search […]

Even though since you’ve clicked on this article you probably know what is Tableau, we’ll quickly remind you. Tableau is an advanced analytics and data visualization platform for data analysts, data-driven enterprises and Big Data companies who live and breathe data analysis. Data visualization is a process of turning data into a visual representation, usually […]

The importance of data visualization is hard to exaggerate. It offers priceless insights into your company’s operations, propels fast decision-making and enables businesses to communicate data easily, therefore becoming more and more data-driven – here’s how. All in all, data visualization is a serious business. But it’s also fun. Especially if you know how to […]

Data visualization is multifaceted. It can help you showcase relations between objects and values, their correlation, their interconnectedness and hierarchy. Today we are talking about the latter – hierarchical data visualization and methods which explain how to show hierarchy with data visualization. Without a doubt, it is important to know which visualization methods are appropriate […]
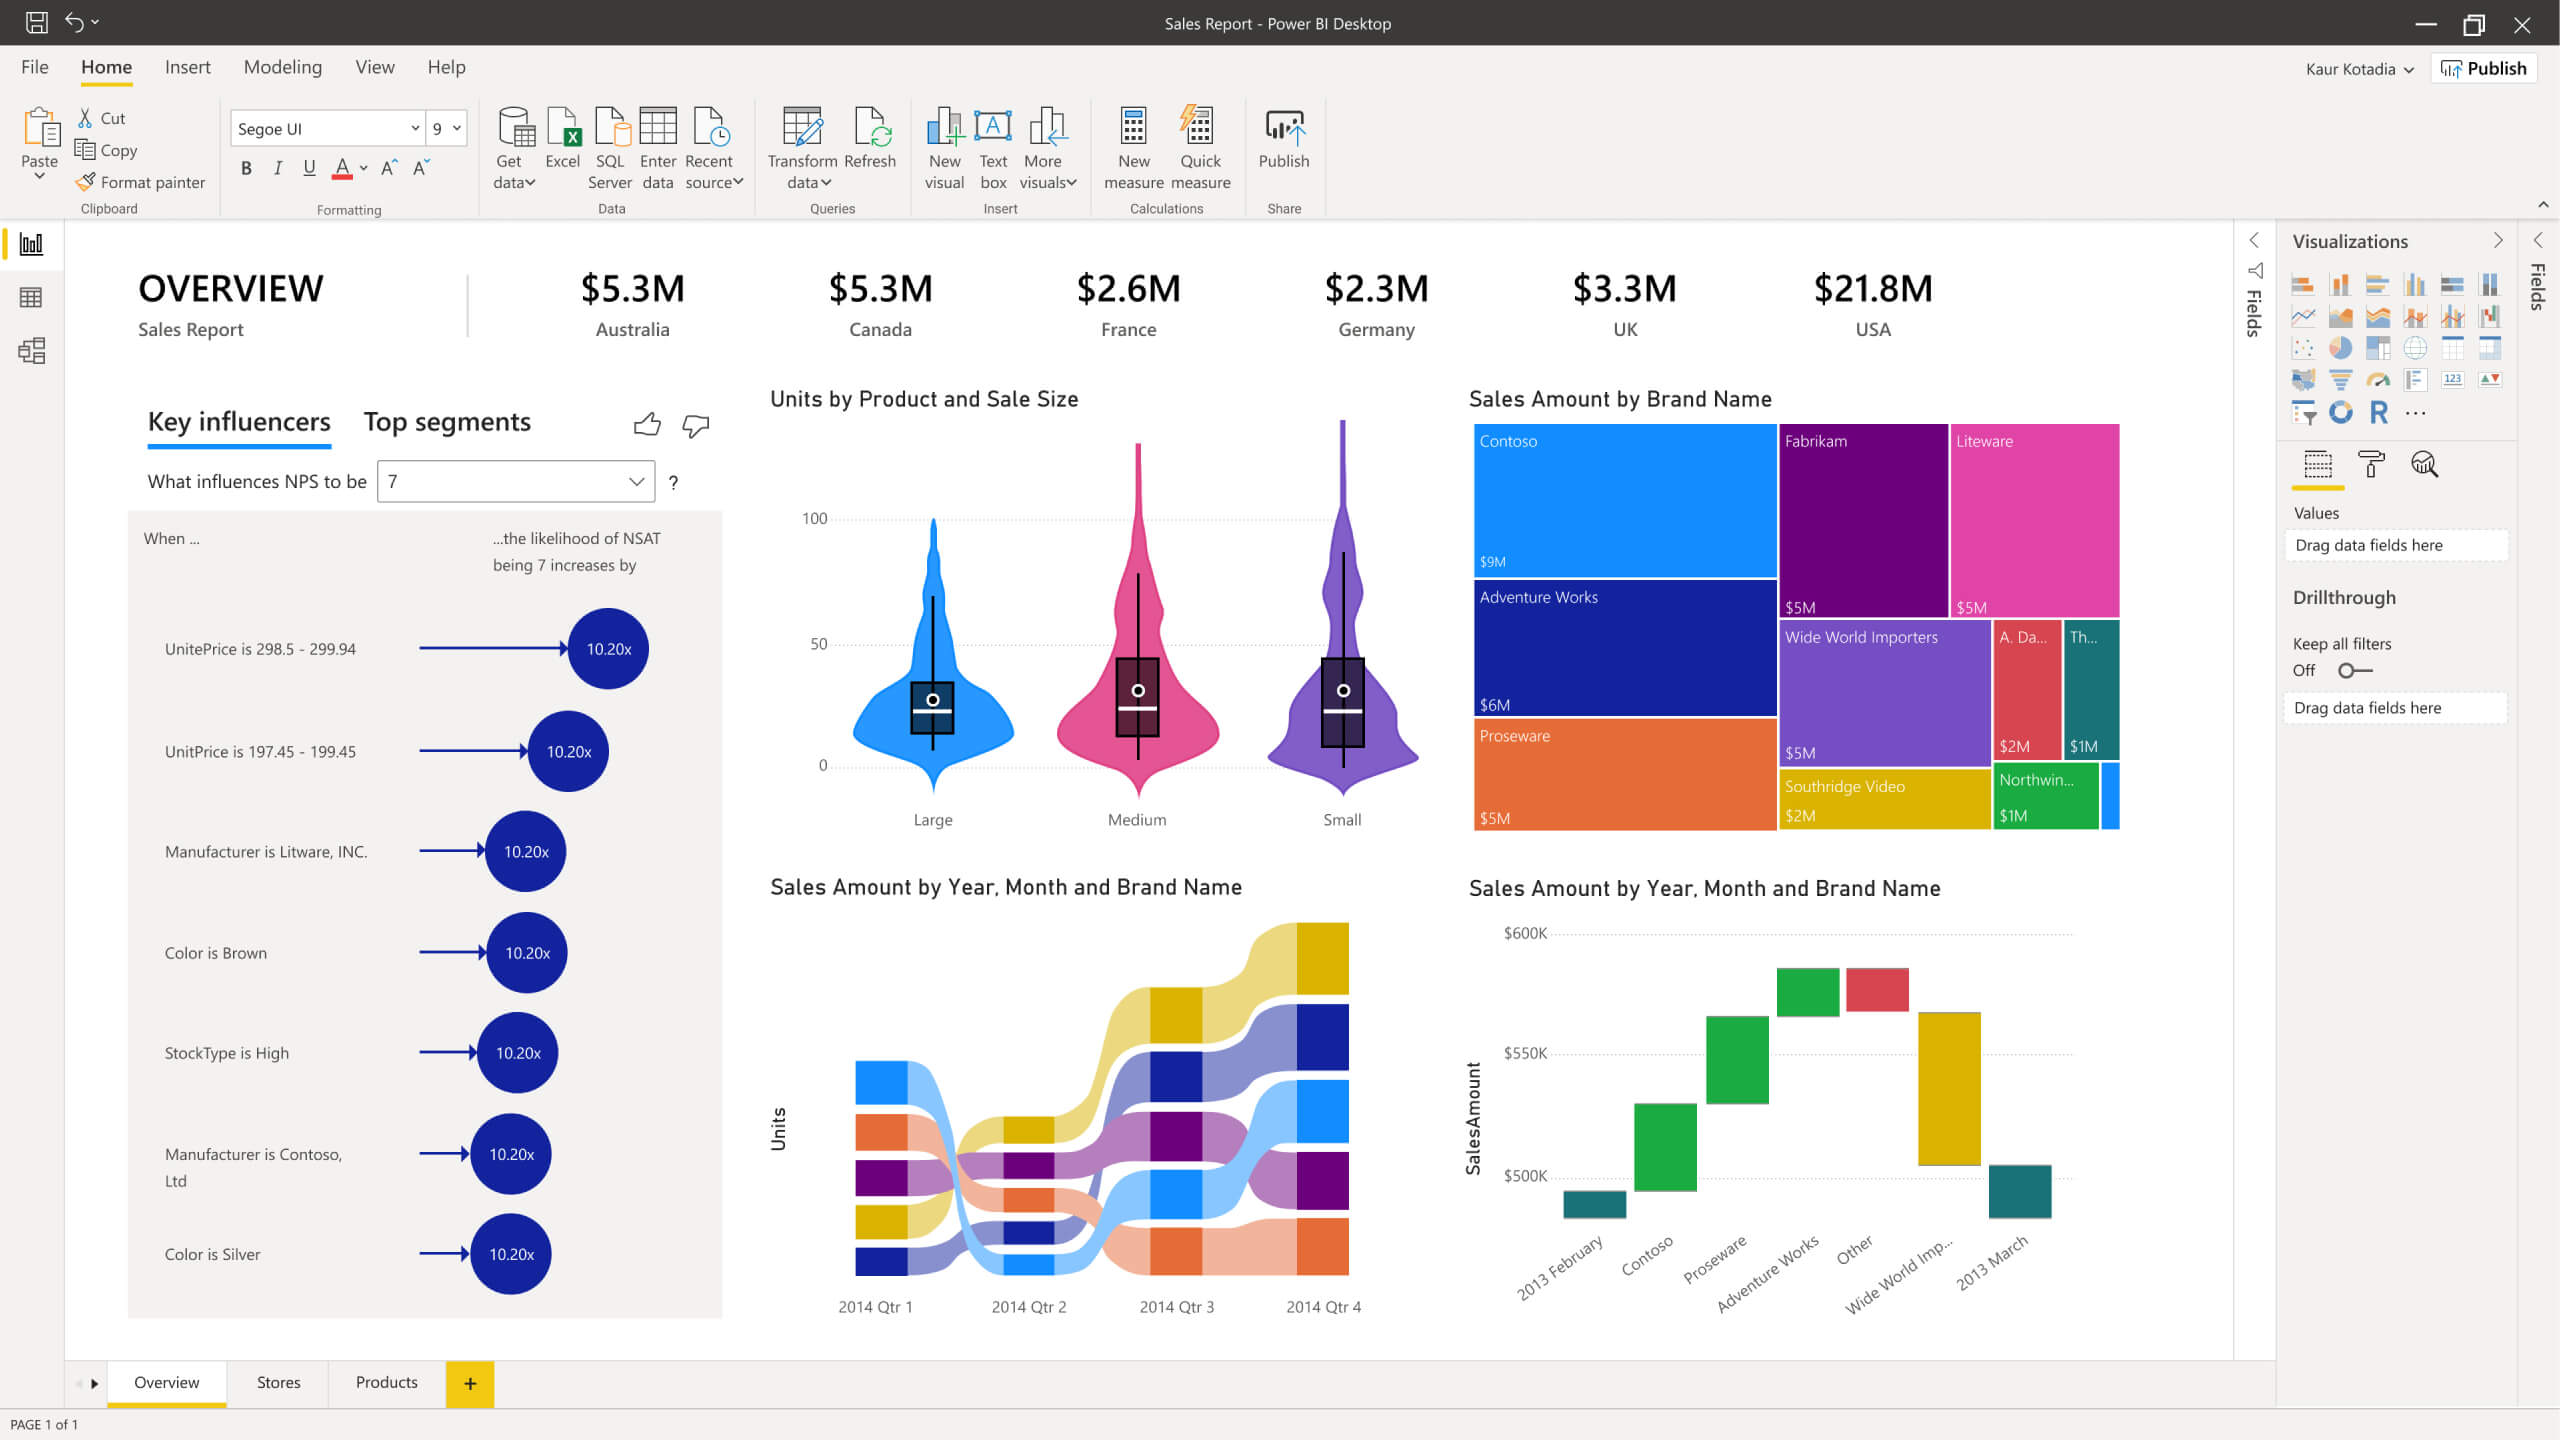
Data Visualization became an important topic in the lives of many companies in the last couple of years. Data Visualization tools like Power BI allow executives to make important decisions faster while making data operations easier. Without setting and processing Data Visualization correctly, it’s had to monitor the efficiency of your sales, advertisement campaigns, business […]