
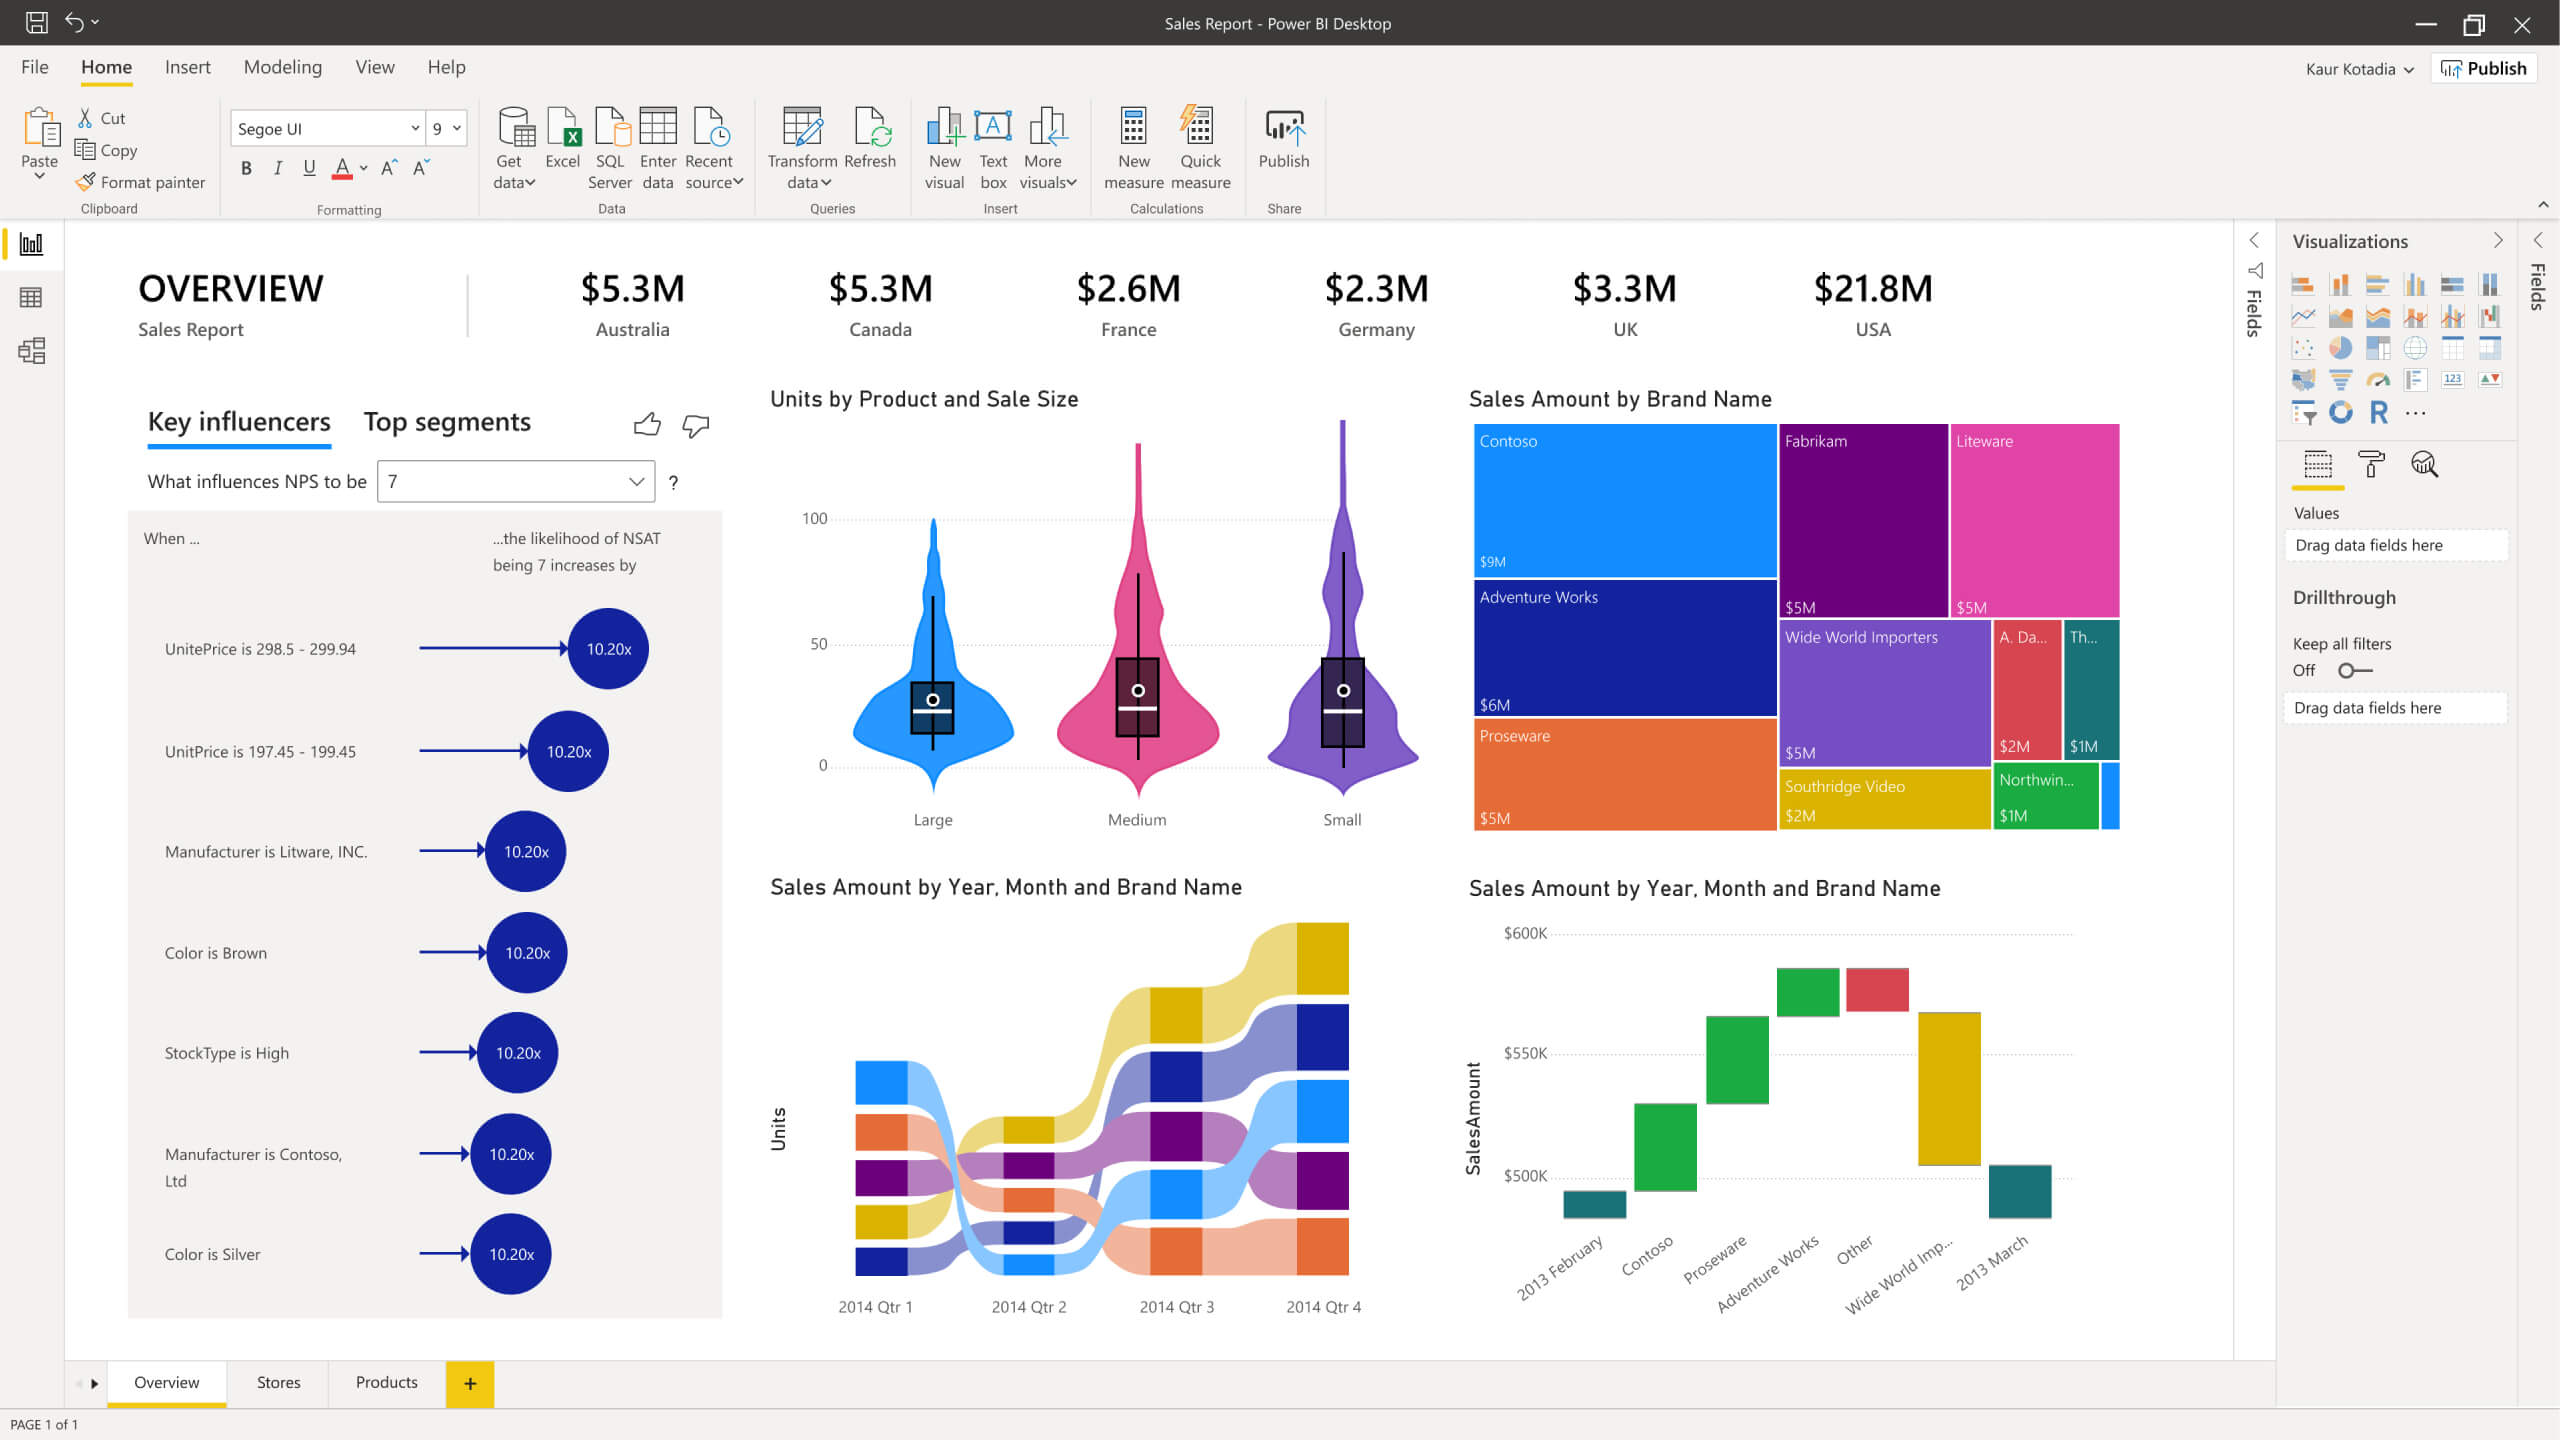
Data is useful when it is processable. After collecting and visualizing your data in one place it is often analyzed in an additional platform. For this particular case, we’ve created a step-by-step article that guides you through the process of exporting the PowerBI dashboard and reports data. You can then open it in your Excel […]
Data Visualization became an important topic in the lives of many companies in the last couple of years. Data Visualization tools like Power BI allow executives to make important decisions faster while making data operations easier. Without setting and processing Data Visualization correctly, it’s had to monitor the efficiency of your sales, advertisement campaigns, business […]

So you have assessed the needs of your company and decided that data visualization is an indispensable tool in the arsenal of any progressive business model. Now the questions are “What is the best data visualization software?” and “Which best data visualization software should I choose?”. Simple. Read our article on Choosing The Top Data […]

Data visualization is one of the hottest and most ever-growing trends in the 3rd decade of this century. In fact, data visualization became so popular and demanded it formed an industry itself, fueled by tons of data visualization software programs and 3-rd party tools that connect those data visualization software to the data sources they […]

Tableau vs Power BI – how do you choose? Both of these data visualization tools have been on the market for quite a while, and both already got an army of fans and a group of haters. Both are quite similar in some respect, and both are quite different in others. To help you choose […]

Choosing Data visualization software is a complex task. When you are swamped with large amounts of information coming from your data analytics tools, the task of organizing and understanding your data becomes apparently critical. This is why we choose to review the two best data visualization software on the market and decide which one – […]
Big data visualization tools are necessary for anyone who wants to create visual representations of analytics to share with others or to better understand analytics. You have a number of data visualization tools to choose from — the problem is, no single tool stands out as the very best for business intelligence (BI). If you […]